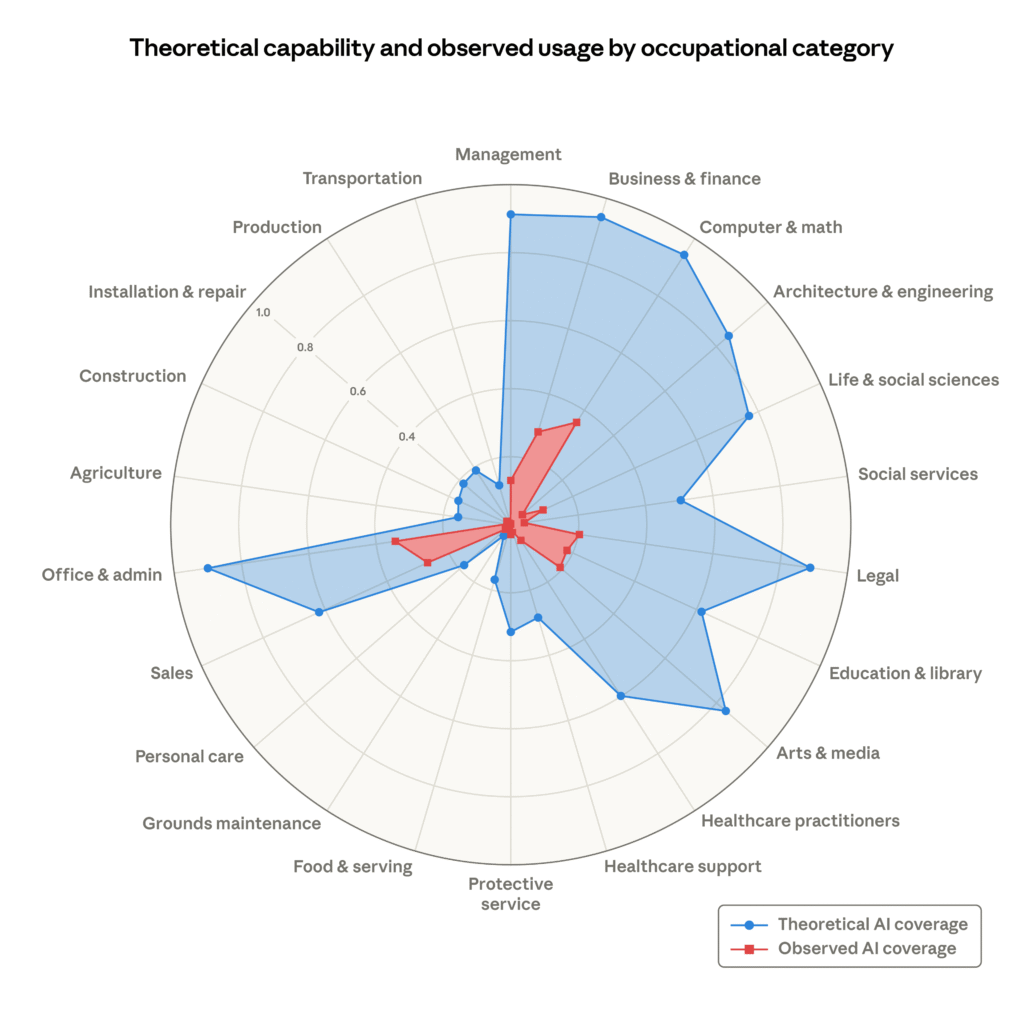
You’ve probably seen this chart floating around. Anthropic dropped a report on AI and the labor market, and the graphic is designed to compare what LLMs are actually doing in jobs today (the red area) versus what they could theoretically do (the huge blue blob).
At first glance, that blue area looks like it’s about to swallow the entire US workforce. Arts & Media, Office & Admin, Legal, Business, Finance, even Management — the graph suggests LLM-based systems could handle at least 80 percent of the tasks in all of those categories. If you’re already worried about AI taking jobs, this thing is fuel for the fire.
But here’s the thing: that blue area is not a prediction of job losses. It’s not even a measurement of current capability. It’s a set of educated guesses about where AI might improve human productivity, based on a methodology that’s both outdated and heavily speculative.
Let me explain what I mean.
The red “observed exposure” data comes from actual usage patterns — Anthropic looked at how people are deploying Claude in real work scenarios. That part is grounded. The blue part, though, is based on a theoretical exercise where researchers asked: “If we assume LLMs keep improving at their current trajectory, what tasks could they eventually handle?” That’s a useful thought experiment, but it’s not a forecast.
Anthropic themselves acknowledge this. The blue area represents tasks where AI could assist a human, not replace them entirely. There’s a massive difference between “an LLM can draft a legal document” and “an LLM can practice law.” The chart doesn’t distinguish between the two.
I’ve been watching these kinds of graphs for years — remember the 2013 Oxford study that said 47% of US jobs were at risk of automation? That turned out to be mostly wrong because it conflated task automation with job replacement. This feels similar.
The real takeaway here isn’t that AI is about to eat the job market. It’s that the gap between theoretical capability and actual deployment is still enormous. The red area shows what’s really happening: AI is being used for specific, narrow tasks within jobs, not entire occupations. And that’s likely to remain the case for a while.
So next time someone sends you that chart with a panicked caption, send them this: the blue blob is a thought experiment, not a prophecy. The red part is what matters.
Comments (0)
Login Log in to comment.
Be the first to comment!